
What Key Performance Indicators (KPIs) should buyers establish for sheet metal suppliers?
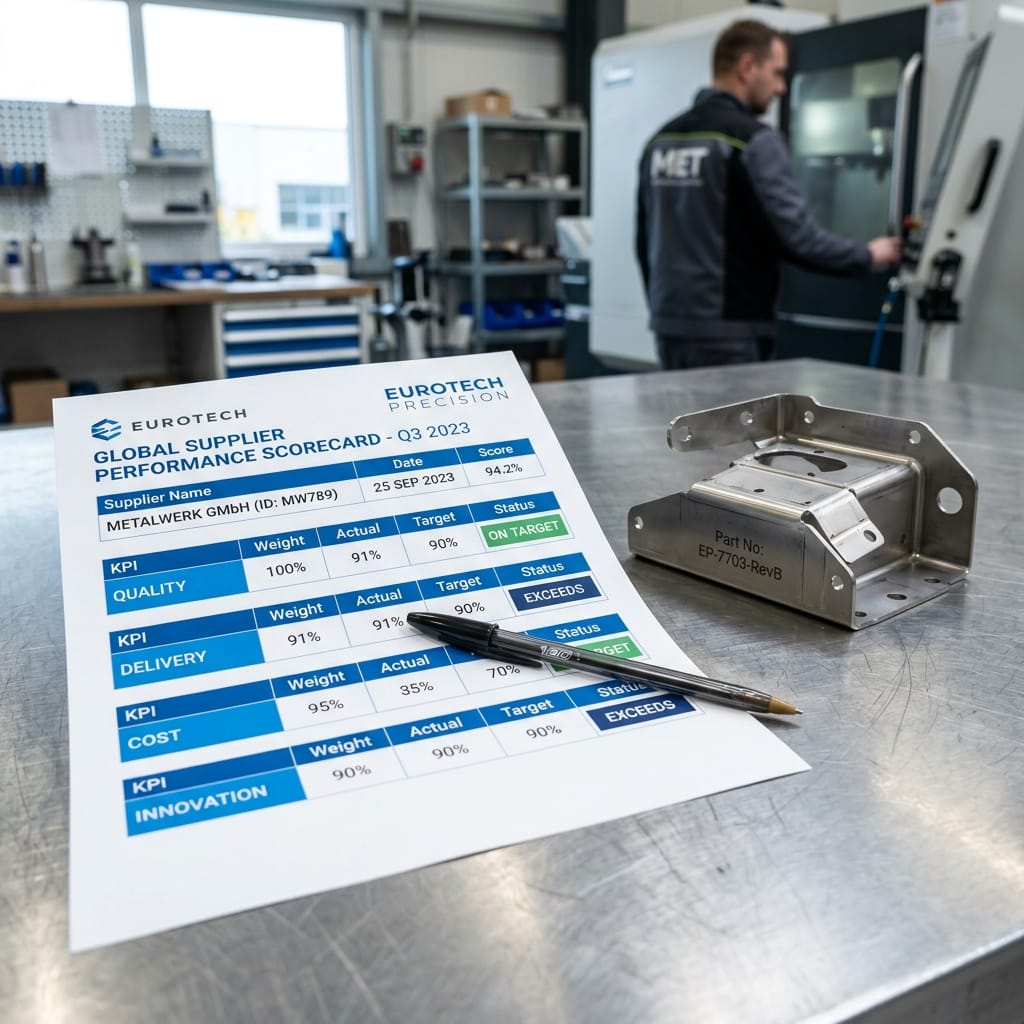
Hardware procurement teams establish a balanced sheet metal supplier scorecard across four core operational pillars: (1) Quality (Defect PPM ≤ 500, First Pass Yield [FPY] ≥ 98.5%, zero unapproved PCNs), (2) Delivery (On-Time In-Full [OTIF] ≥ 98.0% with +0/-2 day grace window), (3) Commercial & Cost (Purchase Price Variance [PPV] ≤ 2%, zero unexpected tooling surcharges), and (4) Responsiveness & Service (RFQ turnaround ≤ 48 hours, 8D D3 containment ≤ 24 hours).
Managing custom sheet metal fabricators through informal email exchanges or subjective impressions leads to chronic operational drift. When things go wrong, suppliers point to fluctuating steel mill lead times, while buyers complain about late assembly deliveries. Implementing a structured, quantitative **Supplier Performance Scorecard** aligns expectations, establishes clear financial incentives, and creates an objective basis for quarterly volume allocation.

The 4 Pillars of a Sheet Metal Supplier Scorecard
1. Quality Excellence (40% We)
The foundation of any manufacturing scorecard. Tracked via three non-negotiable metrics:
- Defect PPM: Calculated as
(Total Defective Parts / Total Parts Received) × 1,000,000. Benchmark target for precision enclosures is ≤ 500 PPM. - First Pass Yield (FPY): Percentage of parts that pass all dimensional and cosmetic checks on the very first inspection attempt without secondary rework. Target ≥ 98.5%.
- Critical Defect Escapes: Zero tolerance (0 occurrences allowed) for safety hazards, missing ground studs, or wrong material grades.

2. Delivery & Logistics Performance (30% We)
Evaluated using the strict On-Time In-Full (OTIF) formula. Measuring shipment dispatch dates is insufficient; the score evaluates arrival at the buyer’s designated facility. Partial shipments and unapproved early deliveries are penalized.
3. Cost & Commercial Stability (15% We)
Measures invoice accuracy, adherence to quoted piece prices, and transparency regarding raw metal index adjustments (e.g., London Metal Exchange [LME] aluminum indexing). Tracks unexpected tooling maintenance surcharges or expedite fees.

4. Engineering & Service Responsiveness (15% We)
Evaluates speed and technical depth in Design for Manufacturability (DFM) reviews, CAD update turnaround for ECNs (≤ 24 hours), and speed of 8D corrective action turnaround (Interim containment ≤ 24 hours; root cause closure ≤ 30 days).
Balanced Sheet Metal Supplier Scorecard Matrix
The table below provides a comprehensive KPI scorecard framework used in Tier-1 hardware supply chains:
| KPI Metric | Target Benchmark | Acceptable Range | Unacceptable (Action Plan) | Score Weight |
|---|---|---|---|---|
| Defect PPM | ≤ 250 PPM | 251 – 750 PPM | > 1,000 PPM | 20% |
| On-Time In-Full (OTIF) | ≥ 98.5% | 95.0% – 98.4% | < 90.0% | 25% |
| First Pass Yield (FPY) | ≥ 99.0% | 97.0% – 98.9% | < 95.0% | 15% |
| 8D D3 Containment Speed | ≤ 24 Hours | 25 – 48 Hours | > 48 Hours | 15% |
| RFQ & DFM Response | ≤ 48 Hours | 49 – 96 Hours | > 5 Business Days | 15% |
| Invoice & PPV Accuracy | 100% Match to PO | ≤ 1% Minor Variance | Unapproved Surcharges | 10% |

Partner With a Top-Decile KPI Performer in Sheet Metal
MSTFAB consistently achieves green-tier KPI performance across premier global hardware accounts: > 99% OTIF delivery, < 200 PPM defect rates, and rapid 24-hour engineering DFM feedback. Contact our procurement leadership team today to review our verified customer scorecards and request a quote.
 WeChat Contact
 WhatsApp Me Directly